NAEP FAQs
The National Assessment of Educational Progress (NAEP), also known as the Nation’s Report Card, is the largest ongoing, nationally representative measure of what our nation’s students know and can do in core subjects such as mathematics, reading, science, and writing. NAEP is administered to samples of fourth-, eighth-, and twelfth-graders across the country to produce national-, and to samples of fourth- and eighth-graders, state-level results.
NAEP results are widely reported by national and local media. Teachers, principals, researchers, parents, and policymakers all use NAEP results to track how students of the nation, the states, and certain urban districts perform over time.
Biennial state NAEP reports provide reliable “snapshots” of education, identifying and comparing gaps between student subgroups as well as achievement over time. Additionally, NAEP offers the following:
- Achievement-level information on nationally representative samples of students in grades 4, 8, and 12 in the arts, civics, geography, mathematics, reading, science, U.S. history, and writing
- Achievement-level information on state-level representative samples of students in grades 4 and 8 in mathematics, reading, science, and writing
- Mathematics and reading achievement-level information on grade 4 and 8 students in urban districts participating in the Trial Urban District Assessment (TUDA). Florida hosts three TUDA districts: Duval, Hillsborough, and Miami-Dade County Public Schools.
- Long-term Trend Assessments that have measured student performance at ages 9, 13, and 17 in reading and mathematics since 1971 by using questions and question formats that have remained relatively unchanged over time
NAEP is a congressionally mandated project administered by the National Center for Education Statistics (NCES), within the U.S. Department of Education and the Institute of Education Sciences (IES). National results include students enrolled in public, charter, and private schools; however, state results only include students enrolled in public and charter schools.
NAEP is a criterion-referenced, digitally based assessment. Approximately half of a student’s testing time is allotted to multiple-choice items, with the remaining half devoted to constructed-response items. Half of the students assessed in science also participate in hands-on tasks. The writing assessment includes two prompts and is administered as a digitally based assessment.
Depending on the type of test and subject being assessed, a representative sample of students is selected. For main NAEP assessments, students are selected from grades 4, 8, and 12. For Long-term trend assessments, test takers are chosen from students aged 9, 13, and 17.
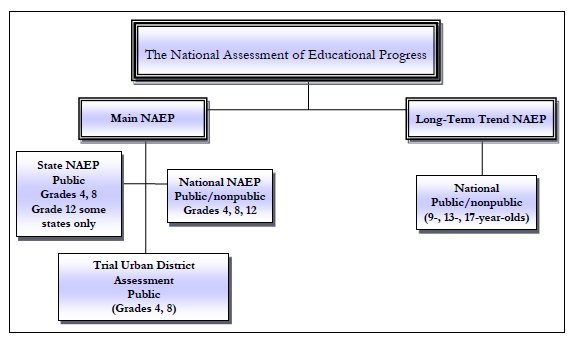
Figure 1 - Main NAEP vs Long-Term Trend NAEP
Each participating student takes only a small portion of the overall assessment. Depending on the size of the school, all students may be selected. However, if the school is large, NAEP will select a representative sample. Student participation in NAEP is voluntary, and parents/guardians must be notified that they may decline having their student participate in NAEP either in part or in its entirety. Parent/guardian refusals must be in writing.
The participation of all selected students enables NAEP to provide the most accurate and representative picture of student performance. Each participating student represents hundreds of similar students and the geographical, racial, ethnic, and socioeconomic diversity present in today’s student population.
As The Nation’s Report Card, NAEP must report accurate results for populations of students and subgroups of these students (e.g., minority students, students from low-income families). To ensure accurate results, the relatively small samples of students must be truly representative of the entire student population in the state.
NAEP uses a stratification process to select a representative sample of schools based on the following:
- Extent of urbanization
- Percentage of minority enrollment
- School standing on statewide achievement tests
- Socioeconomic status of the students
The relative emphasis on each characteristic varies by state, as some states are more diverse than others.
Once the schools are selected, a representative sample of students within each school is selected using a probability sampling design. The goal is to ensure that the resulting sample of students contains a representative cross-section of the student population in the state. Within a selected school, all students in a participating grade have an equal chance of being selected. The probability of a student and school being selected as part of the sample varies based on factors such as:
- Grade
- Subject
- Public, charter, or private school status
- School size
NAEP takes school and student factors into account when calculating results using the process of applying sampling weights. The overall goal of the sampling process is that every eligible student within the state has the same probability of selection.
Additionally, being selected one year does not affect the probability of being selected in a subsequent year. If a school is sampled for participation in NAEP, their probability of selection in future years is unaffected. Smaller schools may be selected repeatedly in states whose student population in a grade is too small to meet NAEP sample size requirements.
Sampling produces accurate estimates of student achievement while reducing the amount of time and cost to administer and score the assessment. Administering NAEP to all students in a state or the nation would be very expensive, especially as NAEP includes many constructed-response questions that are costly to score.
NAEP does not report results for individual students, classrooms, schools, or districts, except for districts participating in the Trial Urban District Assessment (TUDA). Therefore, it is not necessary to assess and report results for every student in every school. If a school is very small, it is highly likely that all students in the grade may be sampled. If the student population is over the allowed maximum number, then the students are randomly sampled by Westat, the NAEP contractor responsible for administering the assessments. It is possible for grade 4 and grade 8 students from the same school to be selected, but the samples are independent of one another and will not be assessed on the same day.
For complete coverage of the subject being assessed, several hundred assessment questions are needed. Testing a student on the entire collection of questions that comprise each NAEP assessment is too time-consuming and impractical. Hence, no single student in the sample takes the entire assessment.
Students with disabilities (SD) and English language learners (ELL) who participate in Florida’s statewide assessments are required to participate in NAEP. In Florida, the statewide assessments are the Florida Standards Assessments (FSAs) and the Florida End-of-Course Assessments (EOCs).
Only SDs who participate in the Florida Standards Alternate Assessment and ELLs who have been enrolled in a United States school for less than 12 months may be excluded from any NAEP assessment. All other SDs and ELLs should participate, with or without NAEP-allowed accommodations.
The accommodations most frequently used for NAEP include:
- Extended time
- Breaks during testing
- Individual or small group administrations
- Heritage language-to-English translation dictionary without definitions (not allowed on the reading assessment)
- Read aloud in English (not allowed on the reading assessment)
In March 2010, the National Assessment Governing Board adopted a policy designed to maximize sample student participation in NAEP by reducing variations in exclusion rates for SD and ELL students across states and districts, developing uniform national rules for including students in NAEP, and ensuring that SD and ELL students are fully represented.
The policy states that the proportion of all students excluded from any NAEP sample should not exceed 5 percent and that among students classified as either ELL or SD, the goal is 85 percent inclusion.
National, state, and trial urban district (TUDA) NAEP assessments are administered biennially in odd-numbered years, in a six-week window between the last week in January and the middle of March. In Florida, Duval, Hillsborough, and Miami-Dade County Public Schools participate in the TUDA program. Field tests are often administered during the same timeframe in the even-numbered years.
The Long-term Trend (LTT) assessment is administered to 13-year-old students in the fall, 9-year-old students in the winter, and 17-year-old students in the spring.
Students participating in the digital-based assessment spend approximately 75 minutes participating in NAEP. The block of time is broken down as follows:
- Two 30-minute cognitive blocks for completion of subject area questions
- 15 minutes to complete student questionnaire
Students participating in the paper-and-pencil assessment spend approximately 90 minutes participating in NAEP. The block of time is broken down as follows:
- 15 minutes for directions
- Two 25-minute cognitive blocks for completion of subject area questions
- 15 minutes to complete student questionnaire
No. There are no individual student, class, school, or district results (unless the district participates in the trial urban district assessment (TUDA), in which case district results are provided). Only a sample of Florida’s grades 4, 8, and 12 students at a sample of Florida’s schools in a sample of Florida’s districts participate in NAEP, and each participating student takes only a small portion of the overall assessment.
The National Center for Education Statistics (NCES) is required to release the NAEP mathematics and reading results within six months of the assessment’s ending date, usually occurring by mid-October of odd-numbered years, except when either of the assessments is based on a new framework. Because of the need for additional analysis, the release of the first-ever digitally based 2017 mathematics and reading assessment results were delayed. Results from all other assessments are released one year after administration.
NCES produces numerous publications that provide assessment results at the national, state, and TUDA level. The results are posted at The Nation’s Report Card website. Web-based tools include the NAEP Data Explorer, NAEP State Comparisons Tool, and NAEP Item Maps.
NAEP results are used by policymakers, state and local educators, principals, teachers, and parents to improve state and federal education policy, including federal and state appropriations issues. Additionally, a great deal of education research is conducted using NAEP data., including standard setting on state-level assessments.
Yes. The NAEP Data Explorer (NDE) analyzes NAEP results and provides educators, researchers, government officials, parents, students, and the media access to detailed results. In addition, the NDE creates statistical tables and graphs that answer questions about the academic performance of the nation’s students and factors that relate to student learning.
NAEP was first administered in 1969 to measure national student achievement. Since then, NAEP assessments have been given in many academic subjects including the arts, civics, economics, geography, mathematics, reading, science, U.S. history, and writing.
Since 1990, NAEP has reported assessment results for both states and the nation, expanding to include results from certain large urban districts participating in the Trial Urban District Assessment (TUDA) in 2002.
Today, NAEP measures, compares, and reports changes in student achievement in states, participating TUDA districts, and other jurisdictions by assessing representative samples of students in grades 4 and 8. Additionally, state-level grade 12 results are available from a dozen self-selected states for 2009 and 2013.
The results of NAEP are released as The Nation’s Report Card. The report card provides a variety of results at the national-, state-, and TUDA-levels, for all students and for different demographic groups.
Reported scores and percentages are based on samples of students rather than on entire populations. Differences between average scale scores or between achievement level percentages are discussed only when they are significant from a statistical perspective. Comparisons between groups are based on statistical tests that consider both the size of the differences and the standard errors of the two statistics being compared. Because NAEP scale scores are reported as an average for groups of students, they may obscure progress or problems related to student performance across a distribution of scores.
NAEP scores are reported in two ways.
- Scale Scores: Scale scores provide a comparison of student performance with regard to a group (e.g., the nation) or a subgroup (e.g., ELL) on a set of items.
- The scale score range for mathematics and reading is 0-500
- The scale score range for science and writing is 0-300
- Averages
- Percentiles (10th, 25th, 50th, 75th, 90th)
- Achievement Levels
NAEP Achievement Levels (ALs) identify what students should know and be able to do at each grade assessed. Results show how different groups are performing in relation to one another and over time. The AL categories are Basic, Proficient, and Advanced. Each level is determined by cut points established by professional educators and the National Assessment Governing Board (NAGB).
A below Basic level describes student scores that fall below the cut score for Basic.
NAEP Achievement Level descriptions:
- Advanced – Superior performance
- Proficient – Solid academic performance for each grade assessed
- Students reaching this level have demonstrated competency over challenging subject matter, including subject-matter knowledge, application of such knowledge to real-world situations, and analytical skills appropriate to the subject matter
- Basic – Partial mastery of prerequisite knowledge and skills that are fundamental for proficient work at each grade
NAEP provides results about subject-matter performance, instructional experiences, and school environment. Results are reported for populations of students (e.g., fourth-graders) and groups of those populations (e.g., male students, Hispanic students). NAEP does not provide individual student, class, or school results.
Because NAEP average scale scores and achievement levels are developed independently for each subject, student performance cannot be compared across subject areas. However, these reporting metrics facilitate performance comparisons within a subject and from one group of students to another in the same grade.
Differences in results—statistical significance
Estimates in the reports and on the website all have a margin of error associated with them. These margins of error are called standard errors, and the sizes of the standard errors influence the results of statistical tests.
Result and score comparisons are based on statistical tests that consider both the size of the differences between the estimates and the standard errors of the two estimates being compared. Estimates based on smaller groups are likely to have larger standard errors. When an estimate has a large standard error, a numerical difference that seems large may not be statistically significant. Standard errors for all results are available in the NAEP Data Explorer.
Prior to 1990, NAEP only reported national results. The types of assessments administered between 1969 and 1988 are shown in the table below.
NAEP state assessments began in 1990 as the NAEP Trial State Assessment (TSA). The types of assessments administered between 1990 and 2017 are shown in the table below. The subjects/grades for which Florida received state-level results are indicated with an asterisk (*). Florida did not participate in state NAEP in 2000 because that was the first year the Florida Comprehensive Assessment Test (FCAT) was administered in grades 3 through 10. National results are available for all of the assessments listed below.
Long-term Trend
High School Transcript Study
Ages 9, 13, 17
Grade 12
Mathematics
Long-term Trend
Grades 4*, 8*, 12
Ages 9, 13, 17
Geography
U.S. History
Long-term Trend
High School Transcript Study
Grades 4, 8, 12
Grades 4, 8, 12
Ages 9, 13, 17
Grade 12
Science
Long-term Trend
Grades 4, 8*, 12
Ages 9, 13, 17
Writing
Civics
High School Transcript Study
Grades 4*, 8*, 12
Grades 4, 8, 12
Grade 12
Mathematics
Science
Grades 4, 8, 12
Grades 4, 8, 12
U.S. History
Grades 4, 8, 12
Writing
Grades 4*, 8*, 12
Reading
Grades 4*, 8*
Reading
Science
High School Transcript Study
Grades 4*, 8*, 12
Grades 4*, 8*, 12
Grade 12
U.S. History
Economics
Grades 4, 8, 12
Grade 12
Reading
Writing
Grades 4*, 8*
Grades 8*, 12
Long-term Trend
Ages 9, 13, 17
Reading
Science
High School Transcript Study
Grades 4*, 8*, 12*
Grades 4*, 8*, 12
Grade 12
Geography
U.S. History
Grades 4, 8, 12
Grades 4, 8, 12
Reading
Science
Writing
Grades 4*, 8*
Grade 8*
Grades 8, 12
Long-term Trend
Writing
Ages 9, 13, 17
Grade 4
Reading
Technology and Engineering Literacy
Grades 4*, 8*, 12*
Grade 8
Geography
U.S. History
Technology and Engineering Literacy
Grade 8
Grade 8
Grade 8
Reading
Science
Grades 4*, 8*, 12
Grades 4*, 8*, 12
Mathematics
Reading
Writing
Grades 4, 8
Grades 4, 8
Grades 8, 12
Reading
Writinge
Grades 4*, 8*
Grades 4, 8, 12
The schedule below was approved by the National Assessment Governing Board (NAGB) on November 21, 2015. The asterisk (*) indicates the years, subjects and grades for which Florida will receive state-level results.
Geography
U.S. History
Technology and Engineering Literacy
Grade 8
Grade 8
Grade 8
Reading
Science
High School Transcript Study
Grades 4*, 8*, 12
Grades 4*, 8*, 12
Grade 12
Reading
Writing
Grades 4*, 8*
Grades 4, 8*, 12
Economics
Geography
Technology and Engineering Literacy
U.S. History
Grade 12
Grades 8, 12
Grades 8, 12
Grades 8, 12
Reading
Science
High School Transcript Study
Grades 4*, 8*, 12
Grades 4*, 8*, 12
Grade 12
Foreign Language
Long-term Trend – Reading and Mathematics
Grade 12
Ages 9, 13, and 17
Yes. After most assessment cycles, NAEP releases a portion of the main assessment. The NAEP Questions Tool (NQT) provides easy access to NAEP questions, student responses, and scoring guides. The tool also provides results for each state and trial urban district (TUDA) as well as national results on all released NAEP items.
The NQT allows users to print selected questions and all their relevant information. By providing teachers, researchers, and educators greater access to NAEP assessment items, the NQT is intended to help foster an understanding of and preparation for both state and NAEP assessments.
Sample Questions booklets containing many of the features of the actual assessments, including instructions, sample subject-area questions and student responses, are available for upcoming and recent assessments at https://nces.ed.gov/nationsreportcard/about/booklets.aspx.
For a history of NAEP, please refer to NAEP Overview, Additional Resources, Chronology of NAEP (Word).
Visit the following websites for more information about NAEP:
NAEP is a federally authorized assessment that is also mandated by section 1008.22, Florida Statutes, Student assessment program for public schools. All schools receiving Title I funds are required to participate in NAEP as part of the Elementary and Secondary Education Reauthorization Act of 2001 (No Child Left Behind), which was reauthorized by the Every Student Succeeds Act of 2015. NAEP is considered a vital component of Florida’s state testing program because it provides comparative state and national information about student achievement in mathematics, reading, science, and writing over time for all students and by subgroups.
NAEP is guided by the Every Student Succeeds Act of 2015 and the National Assessment of Educational Progress Authorization Act (part of the Education Sciences Reform Act of 2002), as well as by policies enacted by the National Assessment Governing Board (“Governing Board”).
The Every Student Succeeds Act (ESSA) reauthorized the Elementary and Secondary Education Act (ESEA), first passed in 1965. The ESEA Reauthorization of 2001 (No Child Left Behind) included language pertaining to participation in NAEP mathematics and reading at grades 4 and 8 for states and local districts. ESSA did not make any changes to the law regarding the authorization of or participation in NAEP.
The legislation of the ESEA known as Every Student Succeeds Act requires that:
- NAEP Mathematics and Reading assessments be used as national indicators of student achievement in mathematics and reading at grades 4 and 8.
- NAEP Mathematics and Reading assessments be used as a compliment to state administered assessments.
- NAEP Mathematics and Reading assessments be administered biennially in grades 4 and 8 beginning in 2003.
- Districts in the sample receiving Title I funding be required to participate in NAEP.
- States receiving federal education funds must establish goals for educational improvement, along with a set of state-designed and -administered tests for measuring student performance towards those goals.
The Every Student Succeeds Act also states that:
- The federal government will pay to administer all NAEP assessments.
- A state participating in the biennial mathematics and reading assessments is deemed to have given its permission to the National Center for Education Statistics (NCES) to release all results and data.
- There will be no rewards or sanctions to states, local education agencies, or schools based on state NAEP results.
- Administering NAEP assessments is not a substitute for a state’s own assessment of its third through eighth grade students in mathematics and reading—NAEP only assesses samples of students, whereas No Child Left Behind requires that state tests be administered to all students.
- In Florida, participation in NAEP is voluntary for students but required for schools.
The National Center for Education Statistics (NCES) within the U.S. Department of Education is responsible for managing the NAEP project. The Commissioner of NCES is responsible for ensuring that NAEP background questions do not include questions about a student’s personal or family beliefs or publicly release information on students’ personal identities. After students complete the assessment, their name labels are removed from the booklet covers in order to preserve anonymity.
The independent, non-partisan National Assessment Governing Board (NAGB) oversees and sets policy for NAEP, selecting subject areas for assessment. Staff members from Westat, the NAEP administration contractor, administer the NAEP assessments to the students.
The National Assessment Governing Board (NAGB) is an independent, bipartisan group responsible for overseeing and setting policy for NAEP. The board is made up of 26 members, including local and state officials, governors, state legislators, educators, business representatives, and members of the general public.
Congress created the Governing Board in 1988 to set policy for NAEP. The Secretary of Education appoints NAGB members, but the board remains independent of the U.S. Department of Education. Since 1990, the Governing Board has set levels of achievement—Basic, Proficient, and Advanced—to provide a gauge of how well student achievement matches what students are expected to know and be able to do at different grade levels.
The Governing Board is responsible for the following:
- Guiding the development of NAEP frameworks
- Determining and selecting what subject areas and content to assess
- Setting appropriate student achievement levels for measuring student performance in consideration of what they are expected to know and be able to do at grades 4, 8, and 12
- Developing assessment objectives and test specifications based on widely accepted professional standards to guide the development of valid and reliable assessments
- Developing assessment methodology
- Developing guidelines for reporting and disseminating results
- Developing standards and procedures for national, state, and urban district comparisons
- Determining appropriateness of assessment items and ensuring that they are free from bias
- Taking actions to improve the form, content, and use of NAEP
NAEP is administered because it accomplishes the following:
- Serves as a benchmark based on national levels of proficiency
- Reports national- and state-level results for students in subject areas at a given time and across time—as well as by race and ethnicity, eligibility for the National School Lunch Program (NSLP), students with disabilities (SD), English language learners (ELL), and gender
- Enables certain urban districts, states, and the nation to compare current year results and trends over time
- Assesses student performance reflecting current educational and assessment practices
Each NAEP assessment is built around a framework that serves as both a guide for creating assessment tools and deciding the content to be assessed in a specific subject area. The frameworks are not meant to serve as a national curriculum, but rather as a broadly accepted outline of what content the national assessment should assess.
Frameworks are developed through a comprehensive and inclusive national consensus process involving hundreds of teachers, curriculum experts, policymakers, business representatives, and members of the general public. Educational practices, results of educational research, and changes in curricula are also considered.
Frameworks provide a basic conceptual structure or vision of how to capture data on what students should know and be able to do. After a framework is approved by the National Assessment Governing Board (NAGB), the framework is used to develop an assessment. This same procedure is followed for each NAEP subject test.
To access NAEP frameworks, visit https://www.nagb.gov/naep/frameworks-overview.html.
NAEP is considered a vital component of Florida’s state testing program because it provides comparative state and national information about student achievement in mathematics, reading, science, and writing. NAEP also:
- Helps Florida monitor progress over time
- Offers a wealth of information at no cost to the state
- Places a minimal burden on Florida schools
- Requires no test preparation
- Places Florida’s state results in a national context