Commissioner Pam Stewart: Graduation Rates at 11-Year High - Panhandle
Thursday, December 18, 2014
DOE Press Office
850-245-0413
Commissioner Pam Stewart: Graduation Rates at 11-Year High
~ Nine Panhandle high schools increase grades ~
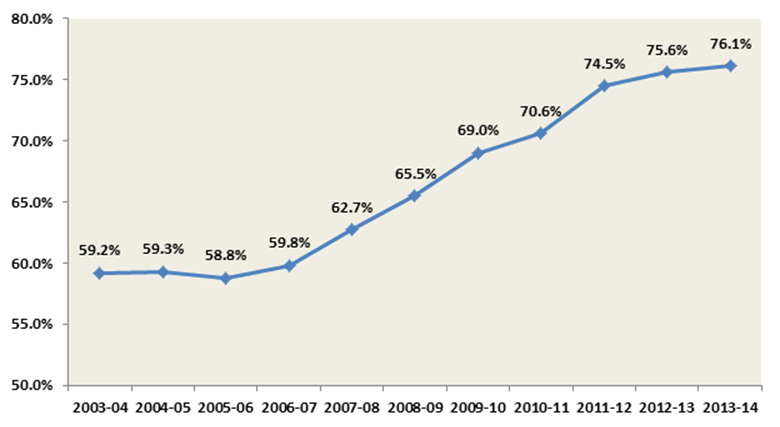
Tallahassee, Fla., December 18, 2014 – According to data released today by the Department of Education, statewide graduation rates increased to an 11-year high of 76.1 percent, an increase of 0.5 percent over last year and a rise of nearly 17 percentage points since 2003-04. The department also announced high school grades for the 2013-14 academic year. After exemplary performance last year, all the thresholds for each letter grade increased. Even with a higher bar, 71 percent of Florida high schools earned top grades of A or B and 55 schools improved their grades since last year.
Commissioner Pam Stewart said, “I’m proud that Florida’s graduation rate has reached an 11-year high of 76.1 percent. This is truly a testament to Florida’s hard-working teachers, principals and administrators who help our students achieve success. My congratulations to the three Panhandle districts for increasing their graduation rates and to the nine schools that improved their grade. I also want to commend the high school graduating classes of 2014 for the commitment they made to earn a diploma.”
Highlights in the Panhandle include:
- Three districts in the Panhandle region improved their graduation rate.
- Calhoun County’s graduation rate increased to 80.8 percent, an improvement of 6.7 percentage points since 2010-11.
- Escambia County improved their graduation rate to 66.1 percent, an increase of nearly two percentage points since last year and 8.4 percentage points since 2010-11.
- Santa Rosa increased their graduation rate to 82.8 percent, a 3.9 percentage point improvement over last year and five percentage points since 2010-11,
Commissioner Stewart added, “I am confident that our state’s educators will continue providing a high quality education that builds on the progress we have made. As always, there is room for improvement. We will continue working closely with all of our school districts to provide the support necessary to ensure Florida students are prepared for college, a career and life.”
About Florida’s Graduation Rates, 2003-04 through 2013-14
The graduation rate measures the percentage of students who graduate within four years of their first enrollment in ninth grade. The rate is calculated for an adjusted cohort of students – a group of students on the same schedule to graduate – taking into account those who enter or exit the group.
Florida’s graduation rate only considers standard diploma recipients as graduates in the calculation. Students who earn a special diploma, a GED-based diploma, a certificate of completion, or have been retained and are still in school after four years are counted as non-completers in the calculation. Since 2010-11, Florida’s graduation rate has risen by 5.5 percentage points since 2010-11 and 16.9 percentage points since 2003-04.

For more information about graduation rates, visit Graduation Rates.
Preliminary 2014 Grades for High Schools and Combination High Schools
State Board of Education rule mandates that if at least 75 percent of schools earn an “A” or “B,” the amount of points needed for a school to earn a school grade is increased in the following year. Since 83 percent of high schools earned an “A” or “B” in 2012-13, in accordance with State Board of Education rule, the grading scale was adjusted upward for high schools in 2013-14.
After receiving input from Florida families and educators, Governor Rick Scott signed legislation in May to simplify the school grading formula to focus on factors critical to student success. This is the final year school grades will be calculated using the current formula.
The new formula emphasizes success measures such as student achievement, learning gains, graduation rates and earning college credit and industry certifications. School grades will be calculated next year using the new formula and schools earning a D or F will not be required to implement turnaround options for one year.
| Number | Percent | |
|---|---|---|
| A | 188 | 36% |
| B | 180 | 35% |
| C | 126 | 24% |
| D | 17 | 3% |
| F | 9 | 2% |
| Total | 520 |
For more information about high school grades, visit School Grades.
Read More News...